Have you found yourself wanting to find some satellite data but didn’t what to look for? You are not alone. Navigating satellite data is not easy.
A large number of satellites orbiting the earth collecting information different parts of our planet as captured in the image by esa (European Space Agency). ESA has been dedicated to observing the earth from space since the launch of its first Meteosat weather satellite in 1977. Over the past 40 years, it has launched a range of satellites, each capturing different aspects about our planet. Each of these are helping us better understand our planet and how the changes we are making are affecting the planet both locally but also globally.
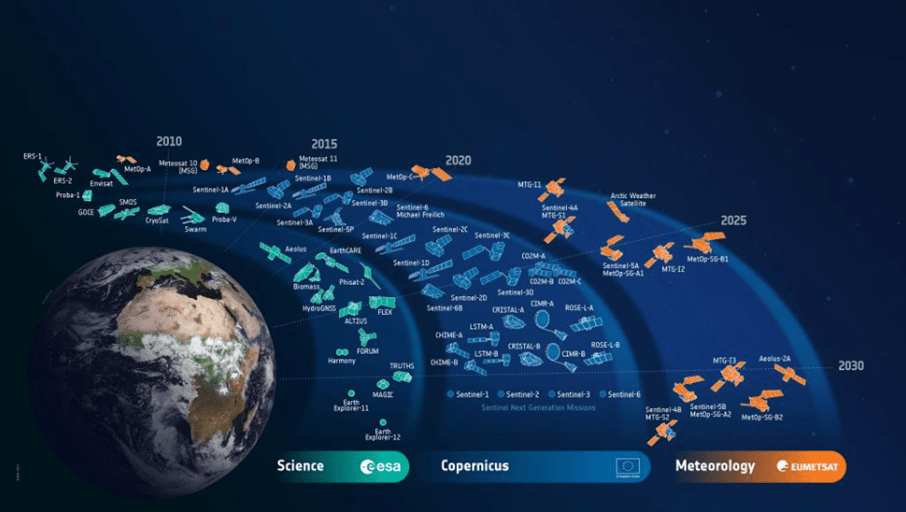
Source: https://www.esa.int/ESA_Multimedia/Images/2019/05/ESA-developed_Earth_observation_missions
Each of these satellites use different sensors to capture information within a certain wavelength or spectral bands. Different wavelengths are useful for capturing different information (more on this later) and is the reason different satellite products are available. Each of these are useful for analysing different aspects of our environment. To illustrate the different information that is captured look at the image provided by the US Geological Survey (USGS) that shows what Landsat satellites are capturing and the spectral range within which they are capturing information.

Spectral bands associated for the Landsat satellites. (Source: USGS, https://www.usgs.gov/media/images/spectral-bandpasses-all-landsat-sensors )
As you can see there are a lot of different sensors capturing information within different wavelengths. But what satellite data to use when? Since each of these products are useful for mapping different aspects of our environment, to give you a sense of what information to use, we have summarised this information in the following table. We have included the band, wavelength, satellite and what the information is useful for mapping. Please note that there are other information available and new satellites are being launched, but for now this should give you a good starting point.
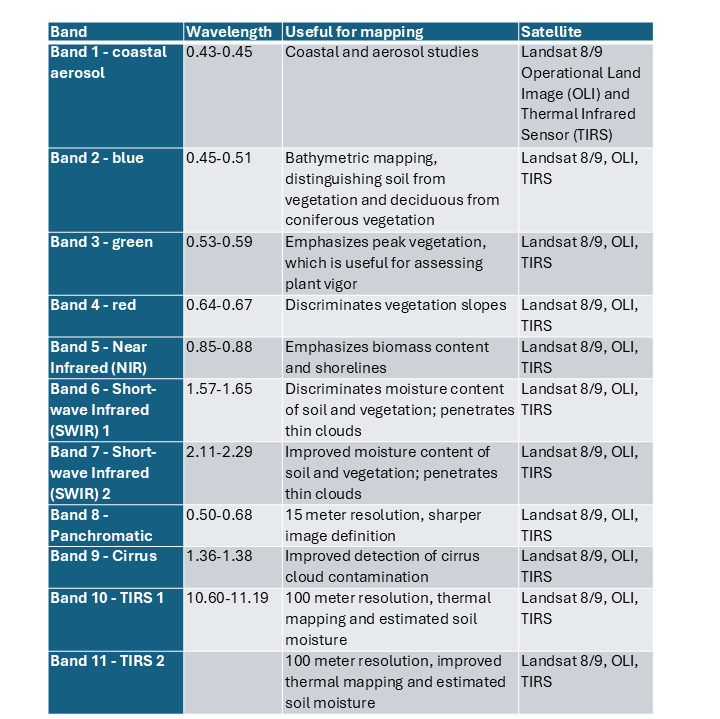

The information in the table was summarised from the Spectral Characteristics Viewer which allows users to determine which satellite bands are best suited for their research application. https://landsat.usgs.gov/spectral-characteristics-viewer. The USGS provides an overview of what landsat spectral bands are useful for identifying certain features. (Source: https://www.usgs.gov/faqs/what-are-best-landsat-spectral-bands-use-my-research)
Alot to take in! If you need more information about satellite images we recommend working with an image analyst/scientist or image data expert!
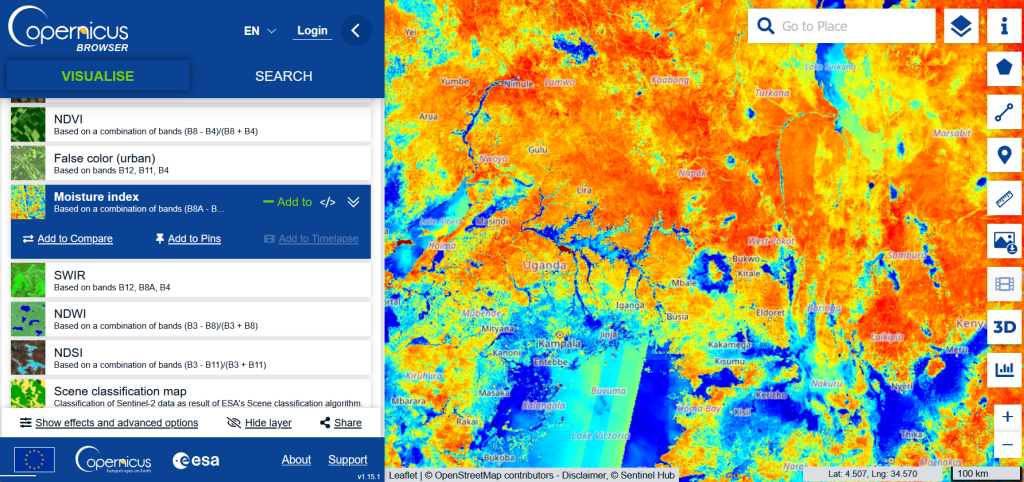
Interested in playing with some imagery? Check out the Copernicus Browser.
© 2023-present GeoSpatialSense. All Rights Reserved
