Mapping mosquito vectored diseases: an integrated geographic data approach
Malaria cases continue to rise with a disproportionate number of cases occurring on the African continent as captured by the map created by the Malaria Atlas Project. In 2023 263 million cases were reported with over 600,000 deaths. Now with the vaccine and technologies that make it feasible to diagnose and map malaria in near-real time, reducing the burden of malaria should become a reality.

To tackle vector-borne diseases such as malaria requires good monitoring strategies and cohesive data systems that make it feasible to integrate a variety of geographic information from different sources with information on the distribution of the vector as well as the diseases they transmit. This is captured in the figure by Blanford (2024).

Illustration of a
- (A) represents a geospatially technologically-integrated society
- (B) captures the diverse data needed for monitoring and managing malaria risk and (C & C.1) the infrastructure needed to store the data in databases locally and in the cloud;
- (D) captures the GIScientists who require a variety of geospatial competencies ranging from data gathering, creation and management to analysis
- (E) captures the mix of tools, methods and knowledge (e.g. data science, spatial analysis, image analysis, domain specific) needed to conduct the analyses
- (F) perform a variety of visualizations and analyses across different spatial and temporal scales;
- (G) the ability to communicate and receive realtime updates between different stakeholders (H)
- (I) a variety interventions methods and strategies available for controlling and eliminating malaria
- (J) Ability to monitor the impact of different interventions in controlling and eliminating malaria leading to a reduction in current and future risks.
A big part of tackling vector-borne diseases is knowing where they are distributed so that the necessary response plans can be implemented. Diseases may circulate at low levels for an extended period of time before they begin to become problematic and lead to outbreaks. This is well captured with the genomic sequencing animations available for various diseases by nextstrain. For example, Zika, a virus transmitted by mosquitoes has been circulating in the South East Asia for a number of years before emerging in Brazil and the Caribbean. To view the information visit https://nextstrain.org/zika
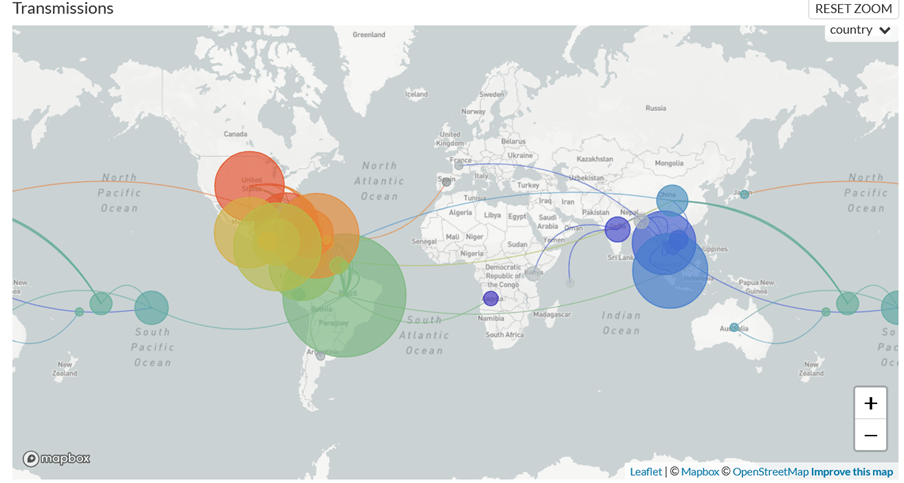
Screenshot of completed animation of the spatial and temporal distribution of the Zika virus based on geophylogenetic mapping 2004-2024.
By coupling the detailed and diverse geographic data available today with spatial data science, a reduction in the vector-borne diseases, such as malaria and zika, should become a reality.
Sources
- Blanford, J. I. (2024) Managing vector-borne diseases in a geoAI-enabled society. Malaria as an example. Acta Tropica, 260. https://www.sciencedirect.com/science/article/pii/S0001706X24002870
- Nextstrain. Real-time tracking of Zika virus evolution. https://nextstrain.org/zika (last accessed Mar 9 2025)
- MAP Malaria Atlas Project. ANALYTICS FOR A MALARIA-FREE WORLD. https://malariaatlas.org/.
- WHO (2022) World malaria report 2022. 372. https://www.who.int/publications/i/item/9789240064898 (last accessed 27 Oct 2023).
- WHO (2023) Malaria. https://www.who.int/news-room/fact-sheets/detail/malaria (last accessed 27 Oct 2023)
© 2023-present GeoSpatialSense. All Rights Reserved
