Recently I was putting together a short tutorial where the participants were going to use a suitability analysis approach to create a map. During the process I realised that I had not explained this process clearly so here is my short post about suitability analysis.
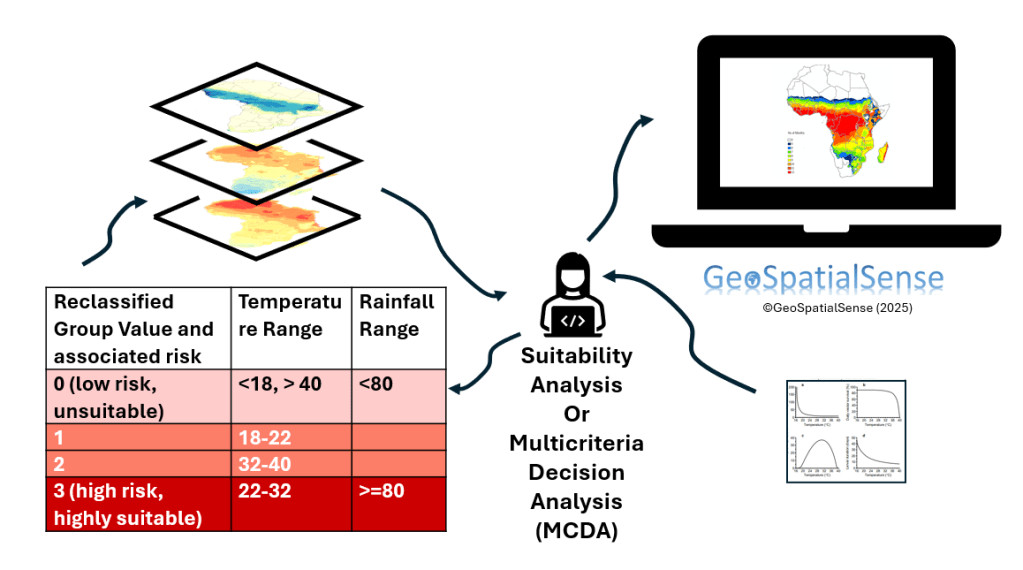
Suitability mapping methods (also known as overlay or multi-criteria decision analysis MCDA) are useful for combining and integrating different criteria, sometimes with different ranges of information. How the information is combined or integrated to create a single score can be based on expert knowledge.
Suitability mapping is used to identify sites that meet a set of defined criteria. Data can be defined in different ways from raw, simple (presence, absence) to complex and be integrated using a variety of techniques that can be summative, reductionist or products. The way in which the criteria are combined can be further refined by weighting each criteria to capture the influence or level of importance of that criteria and how much it contributes to the final score or outcome. The number of criteria can range from 2 to many.
Conducting a suitability analysis
For this method two steps are needed with an optional third as captured in the figure below and summarised in Table 1.
(1) Transform the data where the data for each criteria is preprocessed and
(2) Combine the criteria using the transformed data and
(3) Refine the combined criteria through weighting and the combination/integration methods used.
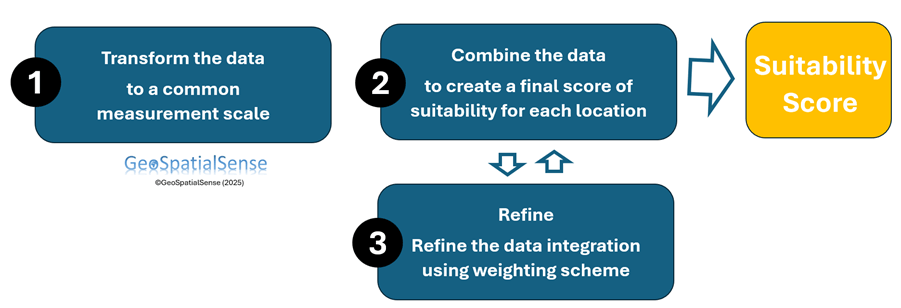
Table 1. Overview of each of the three steps and the methods associated with each step.
| Step | Description | Method |
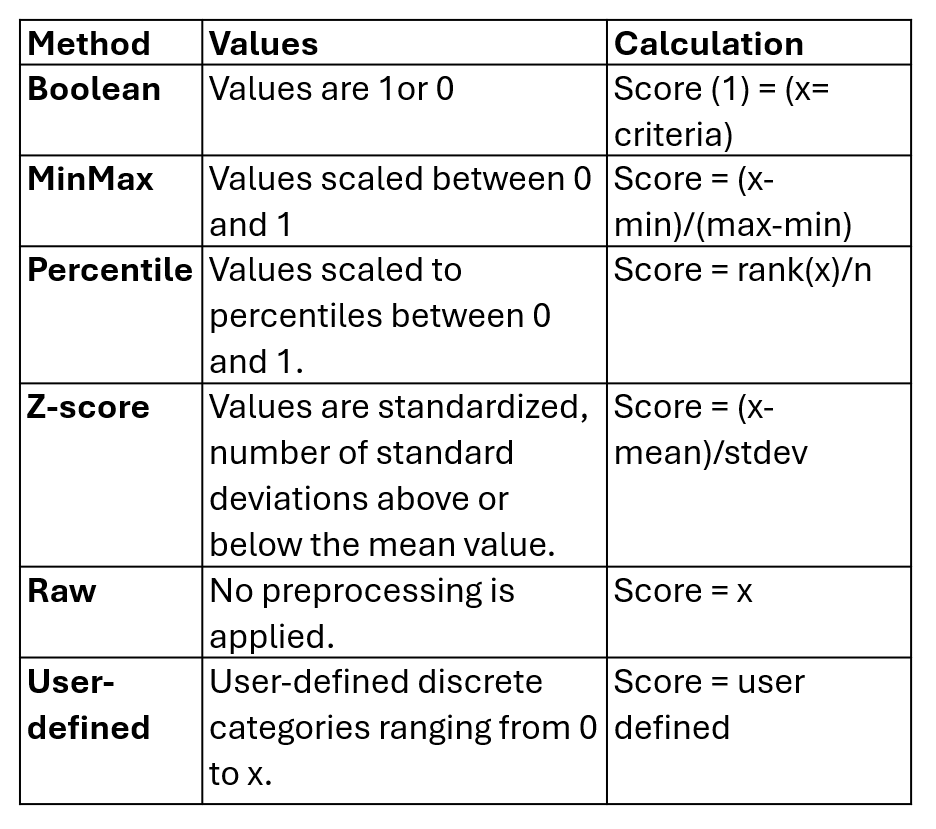
| 1. Transform data | Transform data for each criteria to a common measurement scale | Boolean MinMax Percentile Z-score Raw User-defined |
| 2. Combine criteria | Combine the different criteria to create a single value for each location | Sum Mean Geometric mean Product AND, OR |
| 3. Refining the combined criteria | The importance or influence of different criteria can be adjusted using a weighting mechanism. | Relative Percentage |
The details about conducting a suitability analysis
(1) Transform the data to a common measurement scale. Often we are interested in combining a variety of criteria where each data set is comprised of a wide variety of values making the data incompatible to use together due to differing scales. To make it feasible for the criteria to be integrated together we must first preprocess the data and transform the data into relevant values. Before transforming the data it is important to decide on the scale and membership to use.
- Scale: Decide on whether the data will be comprised of a continuous scale or discrete scale. Decide on the range of the scale or score system to be used (e.g. 0-1, 0-5, 1-5, 0-10, 0-100, etc) and what these values represent. Higher values have a positive influence on the final score, lower values have a greater negative effect on the score or an inverse of the values. Determine what these values mean. For example in the case of malaria values of 5 equals conditions are highly suitable for risk, while 0 equals no risk.
- Preprocessing of criteria: Decide on how to rescale the criteria. What transformation method will be used to scale the data.
Once transformed the data can be combined.
(2) Combine the transformed data. A variety of methods are available to combine the different criteria to create a single value.

(3) Refine the combined criteria. When combining the criteria into a single score it is also possible to adjust the importance of different criteria using a weighting mechanism. Weighting criteria can be used to capture the importance of one criteria over another. Weighting can be relative or based on a percentage.
- Relative weights can be set to one another. Start with all criteria having the same level of importance. Then increase the importance of one criteria while holding all others equal.
- Percentage can be set to the percentage of the total, where the weights for all criteria add up to 100 percent. If you increase or decrease the weight for any criteria, the weights for each remaining criterion automatically decrease or increase proportionately.
These can be implemented as (score*weight) or (scoreweight).
If using weights ensure that the reasoning for selecting a weighting value is justifiable. For further information on suitability analyses see the sources.
For an overview of suitability analysis view
Sources
- Blanford, J. I. 2024a. Geographic information, geospatial technologies and spatial data science for health. CRC.
- Craig, M. H., R. W. Snow & D. Le Sueur (1999) A climate-based distribution model of malaria transmission in Africa. Parasitology Today, 15.
- Eastman, J. R. (2003) IDRISI Kilimanjaro: guide to GIS and image processing. Clark Labs, Clark University Worcester.
- Eastman, J.R. (2012) IDRISI Selva Tutorial. Manual Version 17. Clark Labs, Clark University Worcester.
- Eastman, J. R., W. Jin, P. A. K. Kyem & J. Toledano (1995) Raster procedures for multi-criteria/multi-obiective decisions. Photogramm. Eng. Remote Sens, 61, 539-547.
- ESRI (2024) How suitability analysis works. https://pro.arcgis.com/en/pro-app/latest/tool-reference/business-analyst/understanding-suitability-analysis.htm
- ESRI (2025) An overview of the overlay tool. https://pro.arcgis.com/en/pro-app/latest/tool-reference/spatial-analyst/an-overview-of-the-overlay-tools.htm
- Malczewski, J. & C. Rinner. 2015. Multicriteria decision analysis in geographic information science. Springer.
- Raines, G. L., D. L. Sawatzky & G. F. Bonham-Carter (2010) New fuzzy logic tools in ArcGIS 10. ArcUser, Spring, 8-13.
© 2023-present GeoSpatialSense. All Rights Reserved
