Today much of our environment (and us) can be surveyed remotely through a variety of sensors and technologies. The information collected through these different devices can come in many forms ranging from imagery, video, audio, text or movement/gestures. Much of this information can be mapped either through the metadata that is included in the data or through an ever increasing set of devices that have embedded cheap GPS devices that automatically collect coordinates for our location.
For example, a wide variety of wireless sensors are used to collect and transmit an array of information that help monitor the health of our environment. These can measure light, wind speed, rainfall, temperature, humidity, barometric pressure, water quality, soil moisture as well as noise and pollution and be useful for examining the relationship of health and diseases due to exposure effects.
Geographic information is information that results from observations and measurements referenced to their location on the earth’s surface. The reference information can vary and come in a variety of forms and can include:
- Latitude/longitude
- Grid coordinates from a map
- Street address
- Zip code/post code
- administrative boundaries (e.g. county, municipality, parish, district, country, etc.)
- Place name
The minute geographic information is added to the information it can be mapped! This can be done through a variety of processes depending on what data is available. For example if you have an address then you will be able to obtain latitude and longitude information for that address using a process known as geocoding. If the geographic information references a county or some other form of administrative boundary the information can be geocoded or joined with a spatial dataset containing the administrative boundaries.
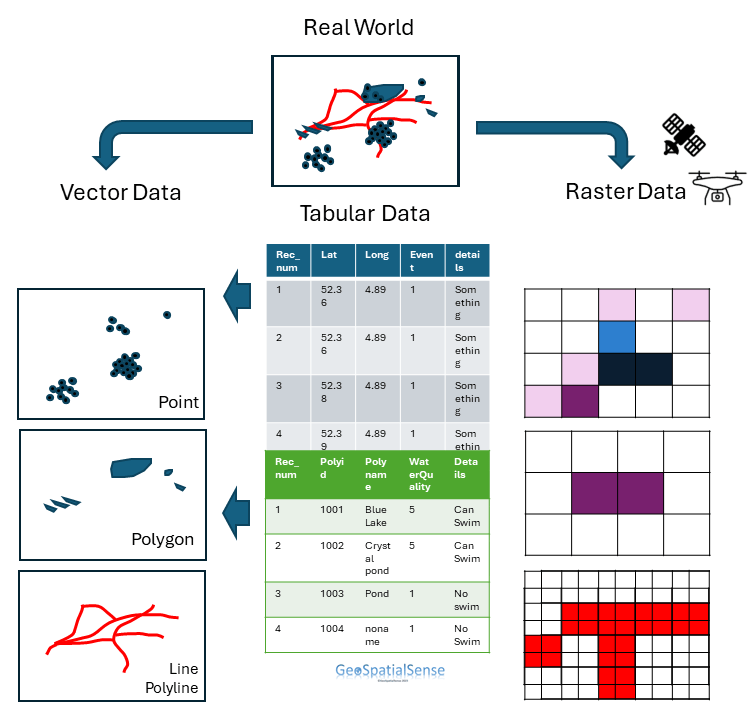
Geographic information can come in a variety of formats that can be vector, raster, tabular or as text.
- Vector (points, polygons, lines)
- Raster (square cells assigned real world entities – imagery)
- Tabular (spreadsheet, tables)
- Text (reports, blogs, social media etc.)
Some of this information may be structured in a way that makes it easy to map while others may be unstructured or less structured. for the latter it will be necessary to organise the information in a way that does provide some structure so that it can be mapped.
A lot of information is available in data repositories. Interested in exploring? Here are some great places to start:
- World climate (Historic and Future) – http://worldclim.org/
- Digital Chart of the World (DCW) – A bit dated but still has good base data (Rail, Road, Water, Boundaries) http://www.diva-gis.org/gdata
- ESRI – http://www.esri.com/data/data-maps/
- ESRI – http://www.esri.com/software/landsat-imagery
- ESRI – http://opendata.arcgis.com/
- Humanitarian Data Exchange – https://data.humdata.org/
- Worldpop – https://www.worldpop.org/
- Open Street Map – https://www.openstreetmap.org/
