
Now that you have some understanding about Spatial Data Science (SDS), GIS, GIScience what is it really all about? SDS uses a mix of statistics, spatial analysis, data science, machine learning methods with visualisation methods to make sense of the world in which we live.
To give you a sense of what is needed I have tried to summarize the different elements used for conducting an analysis or working through a problem or challenge. This is not complete and will change over time as new methods become available but it should provide you with an overview of the different methods that may be drawn on from data science, statistics, or spatial and image analysis methods.
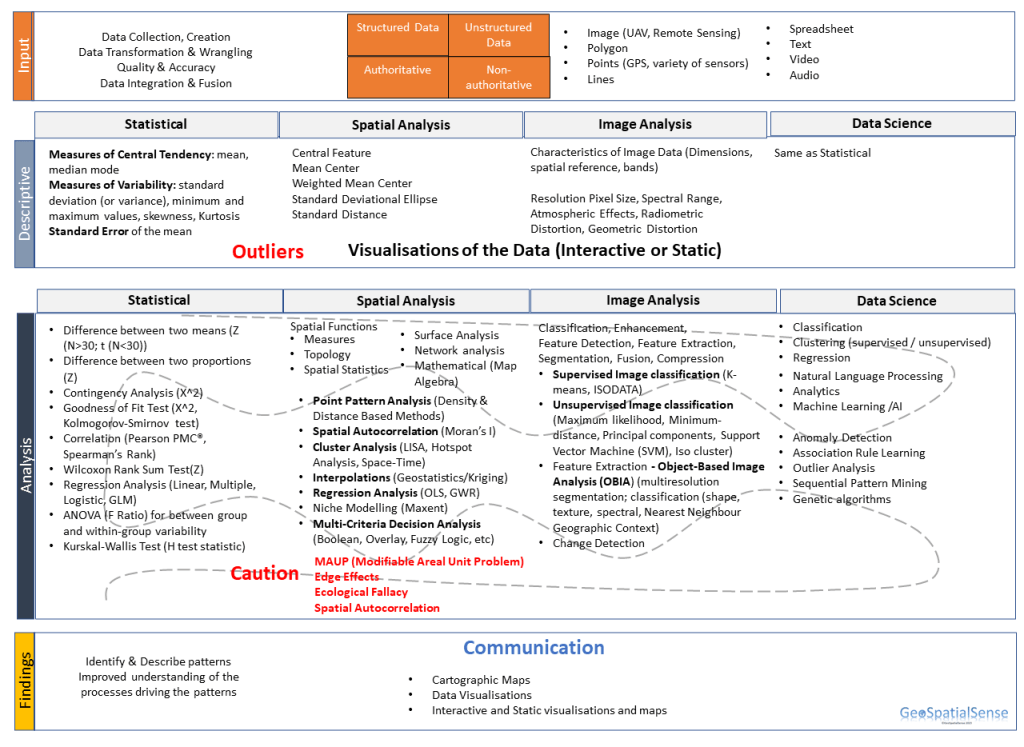
Input – Data creation and acquisition, quality and accuracy: Getting and preparing the data. Making data ready for use involves a number of steps from data acquisition, checking to data engineering where you prepare the data for operational and analytical uses.
Before you can start with your project or analysis you will need some data (either you can collect this yourself or find some on the internet).Vast amounts of information already exist scattered around the globe, some of which is good, some not so good and in a variety of formats. Data can be structured or unstructured and available from authoritative (e.g. National mapping agencies, Government agencies) or non-authoritative sources (e.g. data repositories, open-source, citizen-science or volunteered geographic information). These come in a variety of formats that may require you to extract information, transform information and fuse information with other data to get it in a structured format that will allow you to analyze it in different ways. For example, you could extract information from a text document and then geocode the information based on places mentioned in the text.
Descriptive – Exploration and visualisation During this phase it is also good to explore the data and get to know the data so that you understand what is in the data, how good it is and identify any issues associated with the data. Most importantly does the data contain the information you need to perform the analysis you intend. Many of the descriptive analyses will help with achieve this including data visualisation and cartography.
Transforming the data: If the data is not in the format that is needed to perform the analysis you intend then it will be necessary to transform, organize and clean the data. Once the data is cleaned and ready to go can you finally perform the analysis you intend and answer the questions or hypothesis you had in mind.
Analysis – Analysis and interpretation; modelling and prediction – performing the analysis. Depending on what data you have and the types of questions you are trying to answer will determine what method or set of methods you will use. These can be statistical methods, spatial analysis methods, image analysis methods or data science methods. What is likely to take place is that you will use a variety of methods zigzagging across these depending on need. For example, you obtained some geolocated tweets from Twitter. You create a script to process and summarize the information which you then use to extract the information you need. This will require another script to extract tweets containing certain text. Once processed you will need to convert this into a spatial dataset. Depending on what you are trying to achieve, since the data is point data you may use various Point Pattern Analysis methods to analyse the data. For this to occur you may also use scripting to automate the process or develop an app or software to input or retrieve data. Depending on need this may also be combined with machine learning and artificial intelligence.
Findings – Communicating the findings and contributing to open science: Lastly communicating the findings from the exploration or analysis. This can be achieved in many ways through the use static or interactive maps and a vast array of data visualisations in R.
These skills and methods can be applied across a variety of domain applications and are also useful for better understanding the world in which we live and working towards attaining many of the sustainable development goals.
To see how this links to an earlier post on skills check out the blog on skills for becoming a spatial data scientist.
